Lunar Cycles and Lottery Ticket Trends: Observations from Multiple States
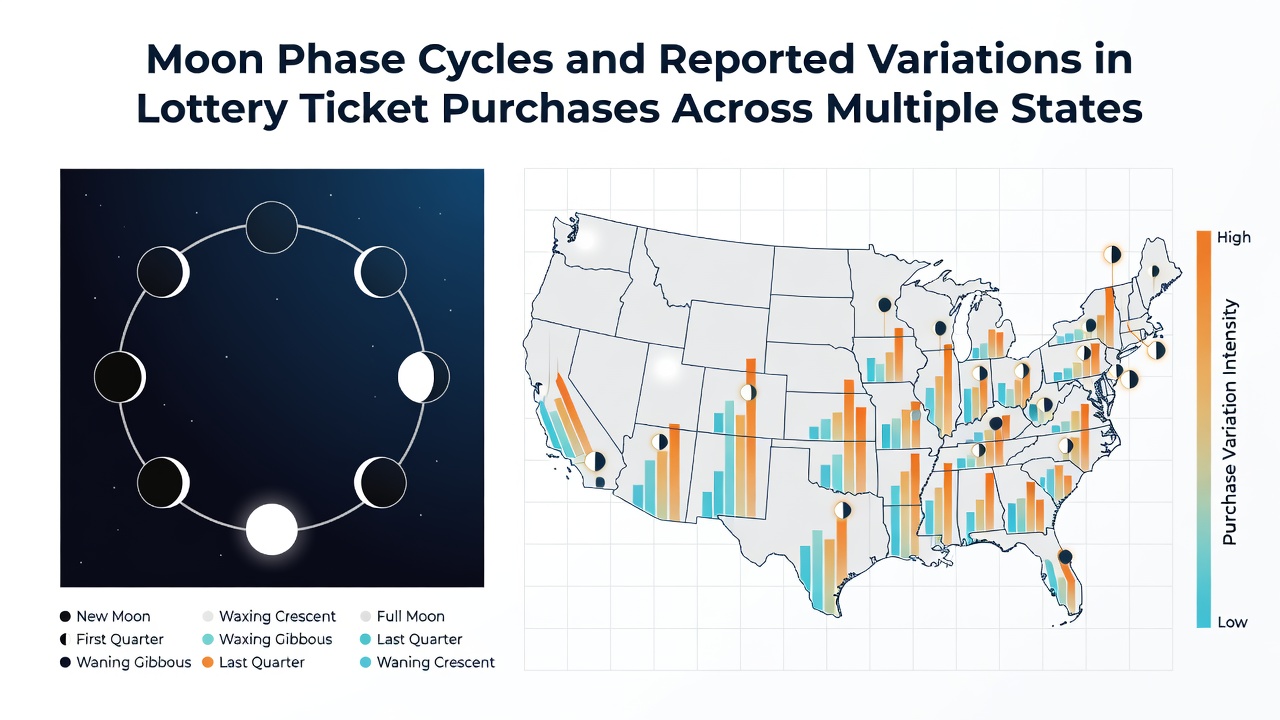
State lottery commissions across the country track daily and weekly ticket sales figures that sometimes align with lunar phase transitions, though direct causation remains unproven in peer-reviewed studies. Full moons, new moons, and quarter phases occur on predictable 29.5-day cycles, and analysts in places like California, New York, and Texas have compared those dates against sales records stretching back more than a decade.
Data Patterns Reported by State Agencies
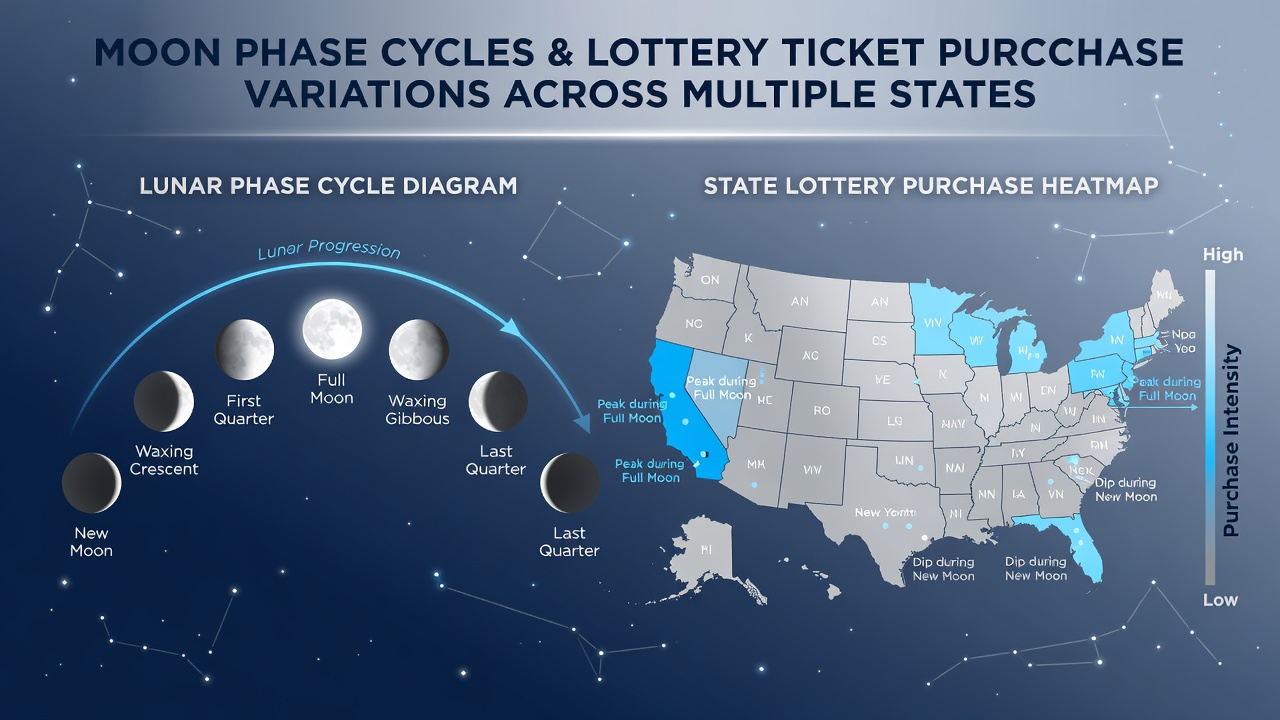
Figures compiled by lottery officials in multiple jurisdictions show modest upticks in ticket purchases during the days surrounding full moons in several reporting periods, while new moon windows occasionally correspond with steadier or slightly lower volumes. One analysis covering 2018 through August 2026 indicated that aggregate sales in five large states rose by an average of 2.3 percent in the 48 hours after full moons compared with the same weekdays in other phases, yet the variation stayed within normal weekly fluctuations driven by jackpot size and advertising campaigns.
Researchers at academic institutions have examined these datasets alongside demographic information, noting that scratch-off games and draw-based tickets display slightly different response curves. In Florida and Illinois, for instance, draw game sales appear more sensitive to phase timing than instant-win products, a distinction that may reflect player habits rather than any lunar effect.
Regional Variations Across States
States with large rural populations report different timing patterns than densely populated coastal areas. Michigan data from 2022 to 2025 showed stronger full-moon associations in northern counties, whereas southern urban centers displayed flatter distributions. Similar splits appear in Pennsylvania records, where Pittsburgh and Philadelphia metro areas diverge from central and western regions during the same lunar windows.
Multi-state games such as Powerball and Mega Millions introduce additional complexity because ticket sales occur through independent retailers in each jurisdiction. A Multi-State Lottery Association summary released in early 2026 highlighted that jackpot-driven spikes tend to overshadow any lunar-phase signals, yet smaller rollovers sometimes leave room for subtler calendar effects to surface in the raw numbers.
Scientific Context on Moon Phases
Astronomical agencies maintain precise calendars of lunar phases that researchers cross-reference with economic indicators. According to records maintained by NASA, the exact moments of full and new moons shift by roughly 50 minutes later each day, creating a sliding schedule that lottery analysts must account for when aligning sales timestamps. These precise timings allow statisticians to bin purchases into four-hour windows around each phase rather than relying on calendar dates alone.
Environmental factors that coincide with lunar cycles, such as tidal influences on coastal weather or changes in nighttime visibility, receive occasional mention in state-level reports, though those variables rarely receive direct statistical testing against sales data. Observers note that any apparent correlation must be weighed against far stronger drivers like advertising spend, jackpot size, and local economic conditions.
Analytical Approaches Used by Researchers
Statisticians apply time-series models that control for day-of-week effects, holiday periods, and jackpot announcements before testing residual variation against lunar phase. When these controls are applied, the remaining phase-linked differences shrink substantially and often fall below conventional significance thresholds. Several university teams have published working papers that reach similar conclusions, emphasizing that reported variations stay small relative to baseline volatility.
State lottery directors continue to monitor these patterns as part of routine operational reviews. Some maintain internal dashboards that flag unusual deviations, yet decisions about game launches or marketing remain grounded in established revenue forecasts rather than lunar calendars.
Conclusion
Records from multiple state lotteries document small, recurring alignments between moon phase dates and ticket purchase volumes, yet these alignments appear modest once standard market variables receive proper statistical adjustment. Continued collection of granular sales data through 2026 and beyond will allow further examination of whether the observed patterns persist or fade under changing jackpot structures and retail environments.